Citigroup Expense Variance
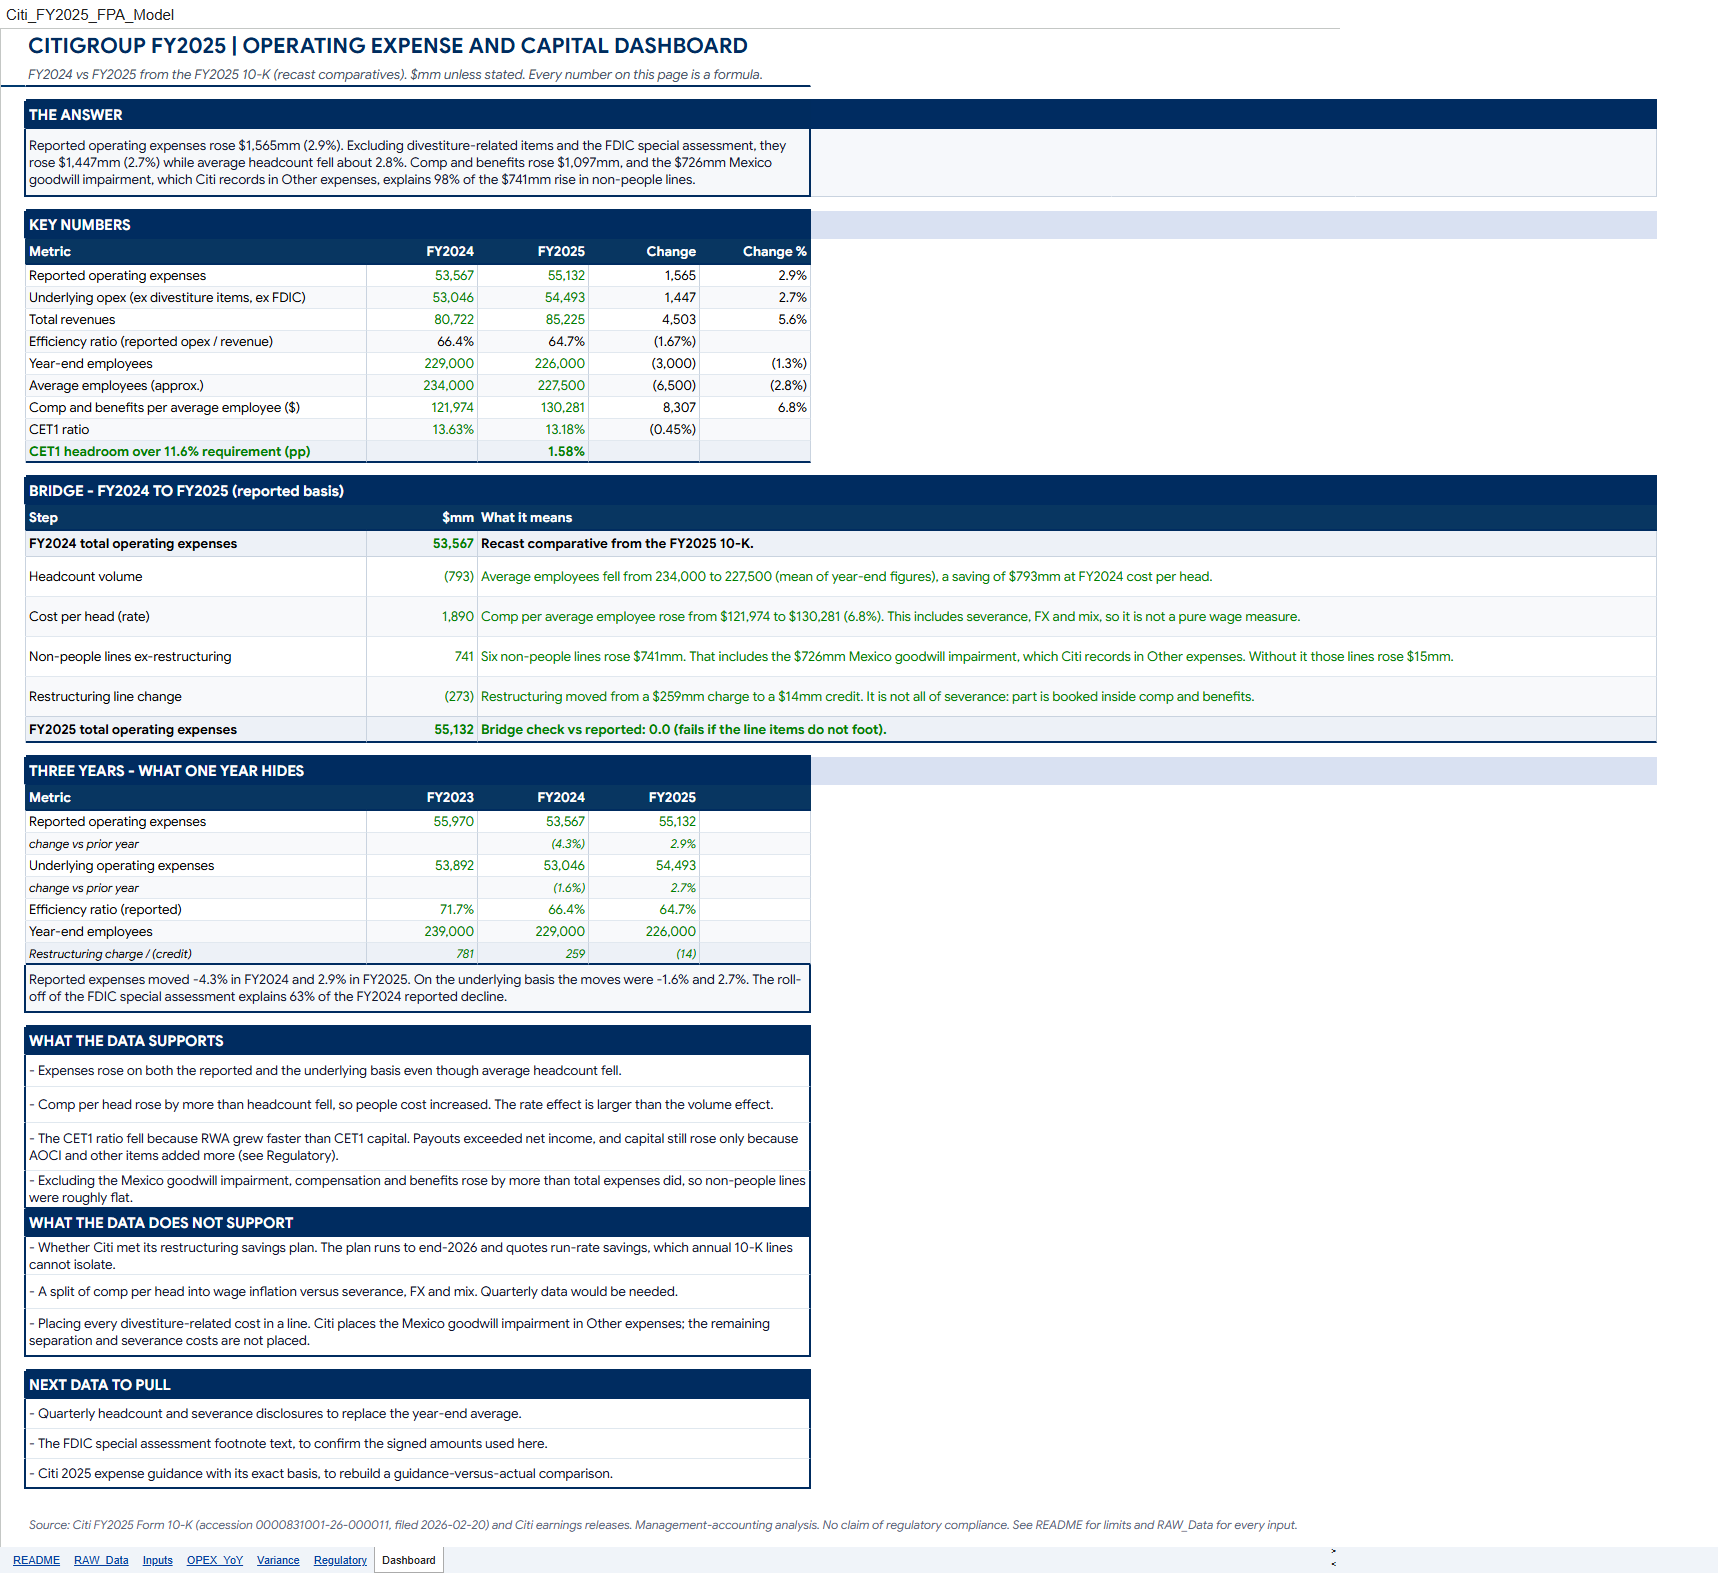
Excel FP&A model explaining why Citigroup's operating expenses rose 2.9% in FY2025 — volume/rate splits, FY24→FY25 bridge, CET1 tied to the 10-K with live integrity checks.
Challenge
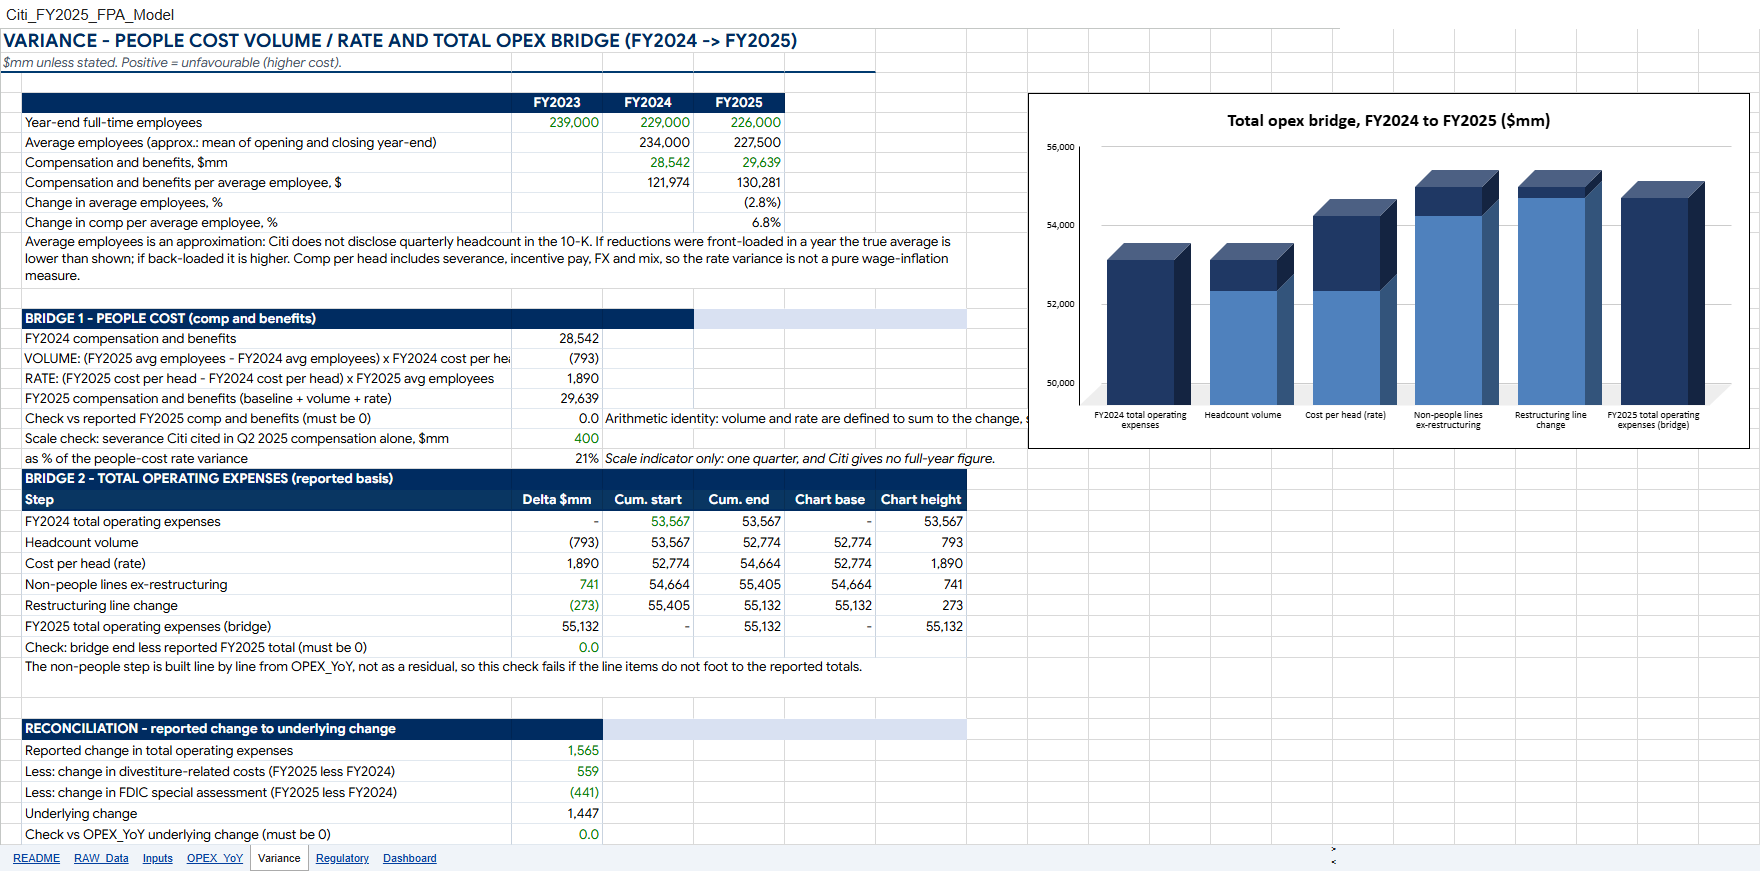
The $259mm restructuring charge flipped to a $14mm credit — yet reported opex still rose $1,565mm (+2.9%). Was it headcount, pay rates, or something else?
Solution
Split people cost by exact algebra (volume −$793mm on 234k→227.5k heads vs rate/mix +$1,890mm — never netted), bridged FY24→FY25 with no plug, isolated the $726mm Mexico goodwill impairment inside the +$741mm non-people move, and walked CET1 to 13.18% with 1.58pp headroom over the 11.6% stack. Seven-sheet model, zero hardcodes outside RAW_Data, 11/11 integrity checks passing.
View GitHub Repo